Analytics & Reporting
Understand your hiring pipeline and make data-driven decisions with Nova's analytics.
🎯 Data-Driven Hiring
Real-Time Insights: Monitor candidate quality as applications come in
Quality Analysis: Understand score distribution and sourcing effectiveness
Pipeline Optimization: Identify trends and improve recruitment strategy
Transform your hiring process with Nova's analytics dashboard—move beyond individual candidate assessments to understand the bigger picture.

Key Benefits
Immediate Visibility:
- Monitor candidate quality as applications flow in
- Track scoring patterns across different sourcing channels
- Identify quality trends in real-time
- Make quick adjustments to recruitment strategy
Live Dashboard Updates:
- Scores update as candidates are processed
- Distribution charts reflect latest applications
- Pipeline metrics refresh automatically
Score Distribution Understanding:
- Percentage breakdown of high-quality candidates (7+ scores)
- Quality vs volume analysis for sourcing optimization
- Average score tracking over time
- Outlier identification for exceptional candidates
Sourcing Effectiveness:
- Compare quality across different channels
- Identify which sources bring better candidates
- Optimize recruitment spend and strategy
Benchmarking Capabilities:
- Cross-role comparison of candidate quality (coming soon)
- Processing volume and throughput tracking
- Quality improvement trends over time
- Performance optimization insights
Core Analytics Features
Score Distribution Analysis
What You See: Interactive visualizations showing how candidates break down by quality scores—from poor matches to exceptional fits.
Key Metrics:
- Quality Breakdown: High-quality (7+) vs poor matches percentage
- Distribution Patterns: Understanding if sourcing attracts right talent
- Average Score Tracking: Overall pipeline quality over time
- Volume Analysis: Application quantity vs quality balance
Performance Benchmarking (Coming Soon)
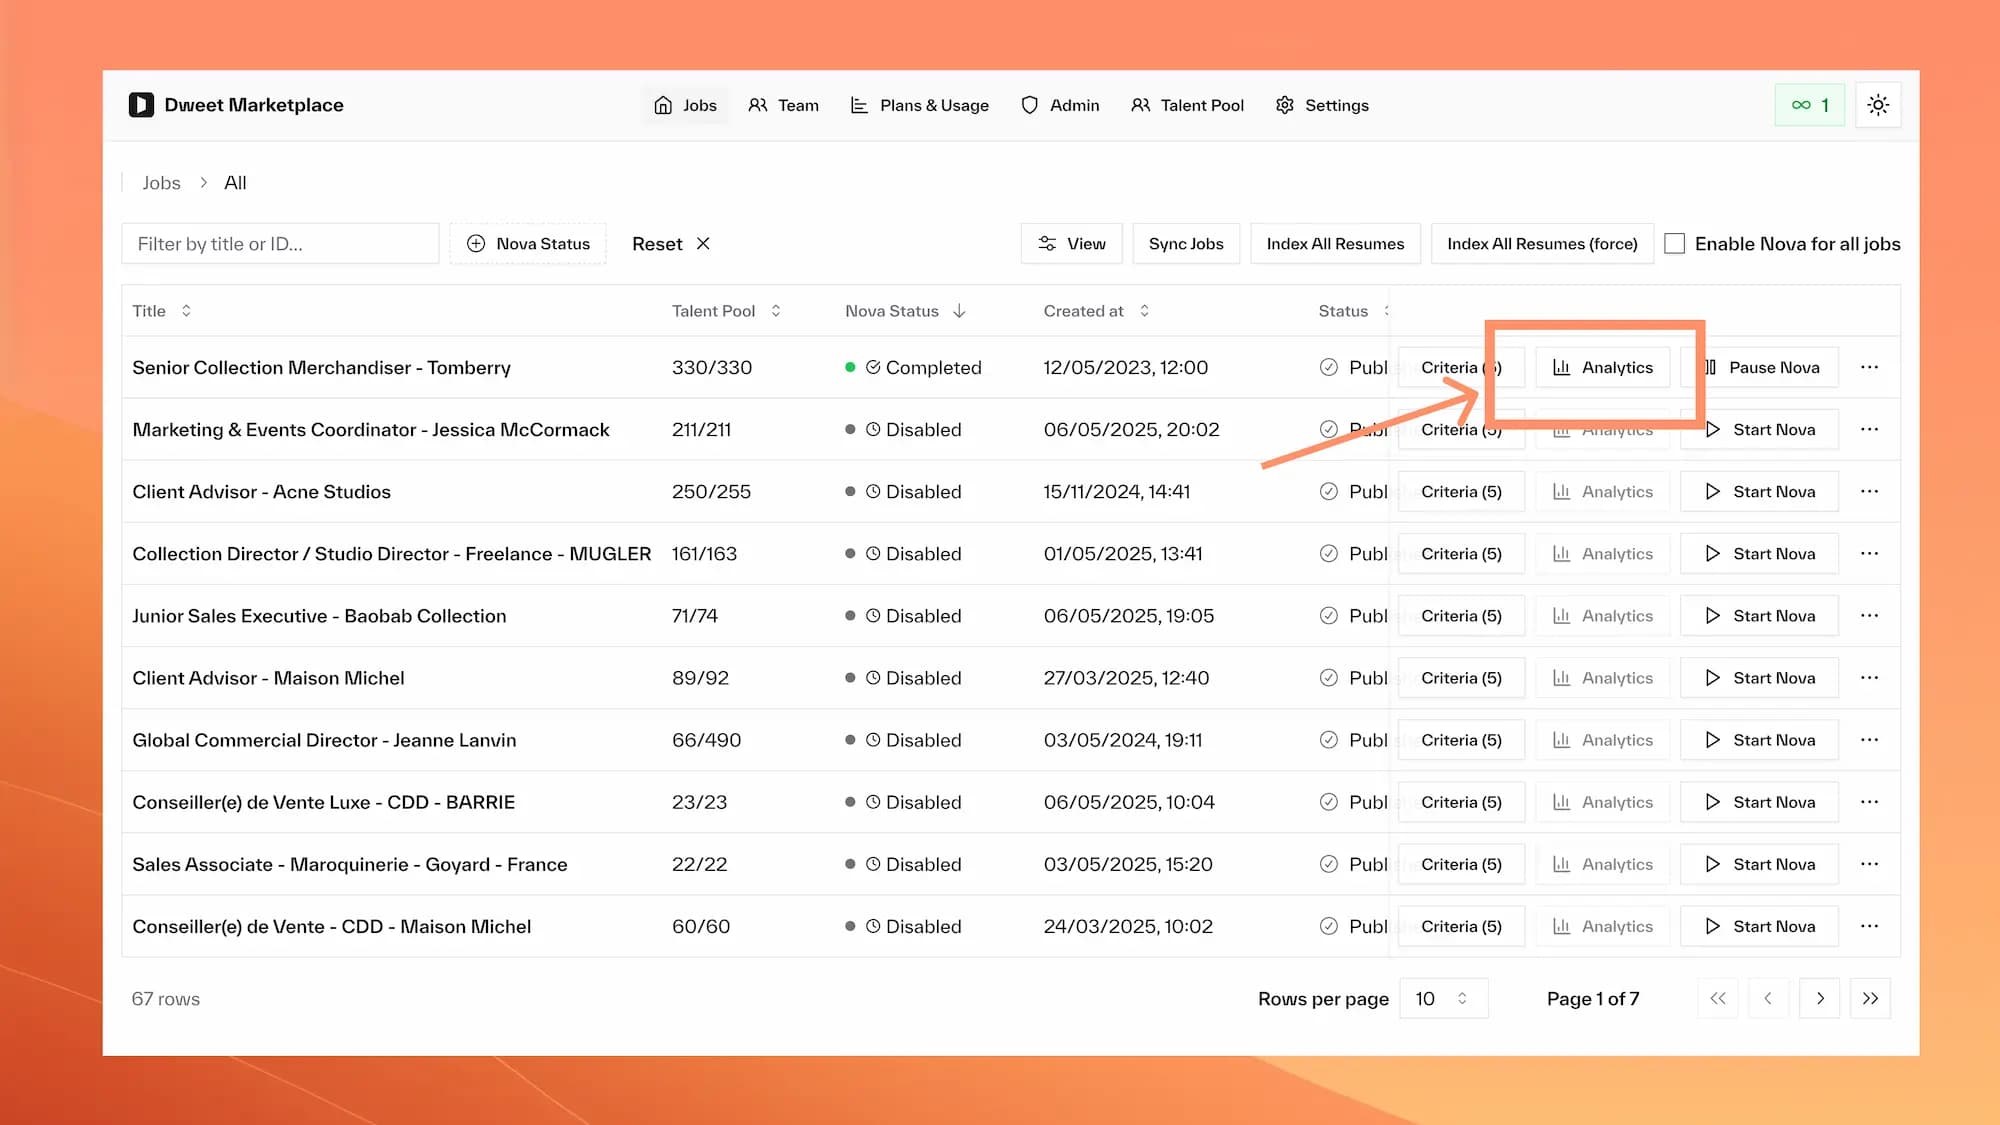
Accessing Analytics
Navigate to Your Job
Go to any job posting that has Nova scoring enabled in your dashboard.
Open Analytics
Click the analytics icon in the job dashboard to access the analytics view.
Explore Your Data
Use interactive charts and filters to dive into your hiring metrics.
Apply Insights
Use data to optimize criteria, sourcing, and recruitment strategy.
Analytics Best Practices
Consistent Review Schedule:
- Check analytics weekly during active recruitment
- Monitor score distribution after criteria changes
- Track trends over monthly and quarterly periods
- Review analytics before hiring team meetings
Key Metrics to Watch:
- Percentage of candidates scoring 7+ (target: 15-25%)
- Average score trends (look for consistent improvement)
- Application volume vs quality balance
- Time-to-process metrics and efficiency
Understanding Patterns:
- High average scores may indicate loose criteria
- Very low scores suggest overly strict requirements
- Consistent quality indicates well-tuned criteria
- Score volatility suggests inconsistent sourcing
Red Flags:
- Sudden drops in average scores (check sourcing changes)
- Very high scores across all candidates (criteria too broad)
- No candidates above threshold (criteria too strict)
- Large gaps in application flow (process issues)
Using Insights for Optimization:
- Adjust criteria based on score distribution
- Optimize sourcing channels based on quality metrics
- Time job postings based on application patterns
- Share successful patterns across hiring team
Iterative Improvement:
- Test criteria changes and measure impact
- A/B test different job posting approaches
- Monitor long-term trends for strategic planning
- Document what works for future roles
Frequently Asked Questions
Pro Tip: Use analytics to validate your hiring assumptions. If data shows patterns different from your expectations, investigate whether criteria need adjustment or sourcing strategy requires changes.
Need help? Contact support for analytics interpretation guidance or reach out to your account manager for advanced reporting capabilities.